We recently hosted a workshop about business applications of virtual reality. One of our key topics was how the VR environment could be utilised in data visualization. While preparing my opening presentation on the topic, I discovered two things: there’s a lot of talk about data visualization using VR but very few real applications exist.
So what is all the buzz about? It has been shown that humans can better comprehend information, when it’s presented utilising all three dimensions. This is nothing new of course, and this can be also achieved on computer screens. However, the real power of utilising virtual reality in data visualisation lies in immersion.
As the user is surrounded by the virtual application, she in a way steps into another reality. The level of immersion makes learning more effective, increasing focus and the bandwidth of information intake. Another advantage of the environment is the ease of interaction with data, even allowing for multiple users to work simultaneously in same virtual space without physical obstacles.
The first topic of our workshop was how user can experience or even learn empathy through VR, which had a major impact on the discussions we had about data visualisation. We came to the conclusion that abstract data visualisations are hard to understand and maybe VR environment could make the data more easily understandable – in a way more humane. Instead of being just understood, could the data be experienced?
After the workshop I had a strong feeling that there’s definitely something more to data visualisation in VR than immersion and interaction. After brainstorming the topic we had an idea: what if the data would be presented as an intractable landscape, easy for anyone to understand and navigate, where nature’s forms and objects (trees, mountains etc.) would present the data geometry.
As a former scientist I am well aware that the idea sounds somewhat pseudo-scientific, so I contacted some of my ex-colleagues (who are still scientists by day) to ask their opinion about this. They weren’t very optimistic about it. For them it was dangerous to illustrate data with objects that have meaning themselves. “Data doesn’t grow like trees or swim like fish..”, they said.
Because of the not-so-encouraging feedback from my scientist friends the concept was basically buried. Then one day somebody at the office linked me a chart that had gone viral. It was a timeline about sea ice coverage, according to which the coverage being exceptionally low this year, considering the time of the year.
:format(webp)/cdn3.vox-cdn.com/uploads/chorus_image/image/51890091/Screen_Shot_2016_11_17_at_12.36.33_PM.0.png) Source: NSIDC
Source: NSIDC
Ice… icebergs… landscape: and that was it! Utilizing Unity 3D-software we built a VR data landscape where the data was presented as icebergs floating in sea, each representing a datapoint on horizontal- (month) and depth (year) axises.
Global sea ice coverage was presented by the height of the icebergs. They rise above the sea level, that covers ground zero on height axis. User can move about the landscape by targeting her gaze to data points and experience the data from different points of views.
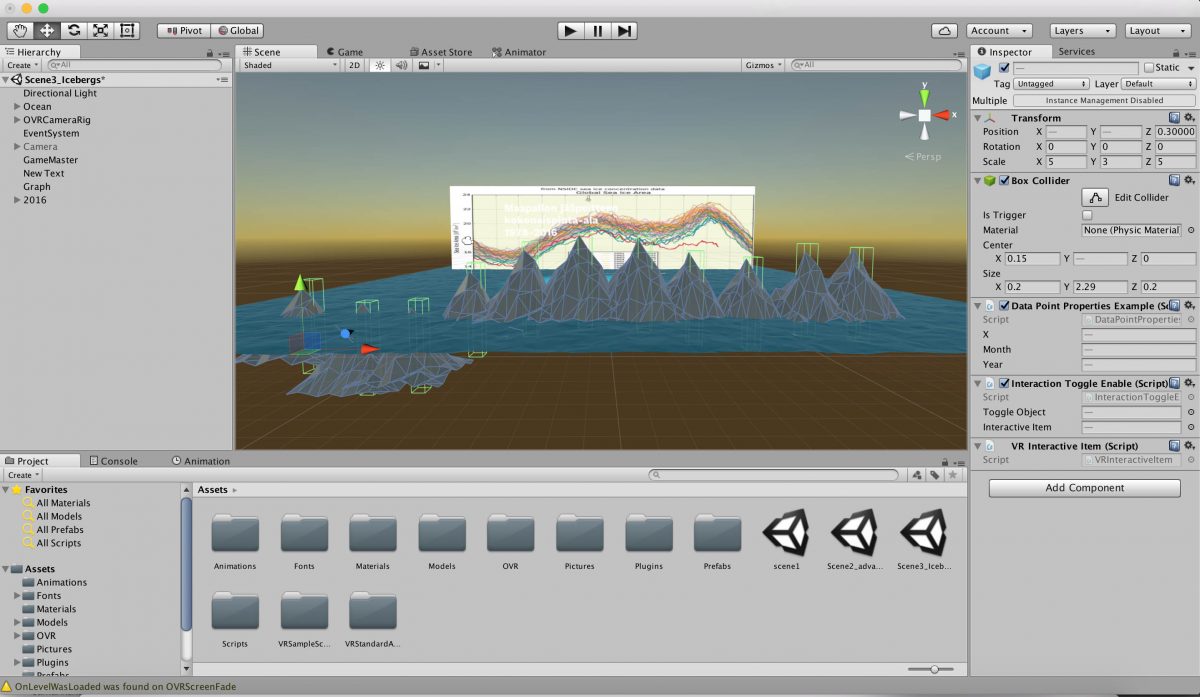 We utilized Unity to reproduce the chart in VR.
Think about standing on the data points with lowest values for global sea ice coverage. You stand near the sea level, with waves almost touching your feet. Gaze another peak among the mountains you see in horizon and you fly on it. Now you see where you came from: an open water area covered with small peaks of iceberg reaching hardly above the water.
As the data visualisation is presented as an interactive landscape easy to comprehend and topped with interactive story and drama, it stops being a presentation and becomes an experience. It is no longer presented but communicated for the user. Strong experience makes an impression, that afterwards feels real, like you actually were on the spot. In addition to immersion and interaction, there’s one more “i” that adds another level in VR data visualisation – it’s impact.
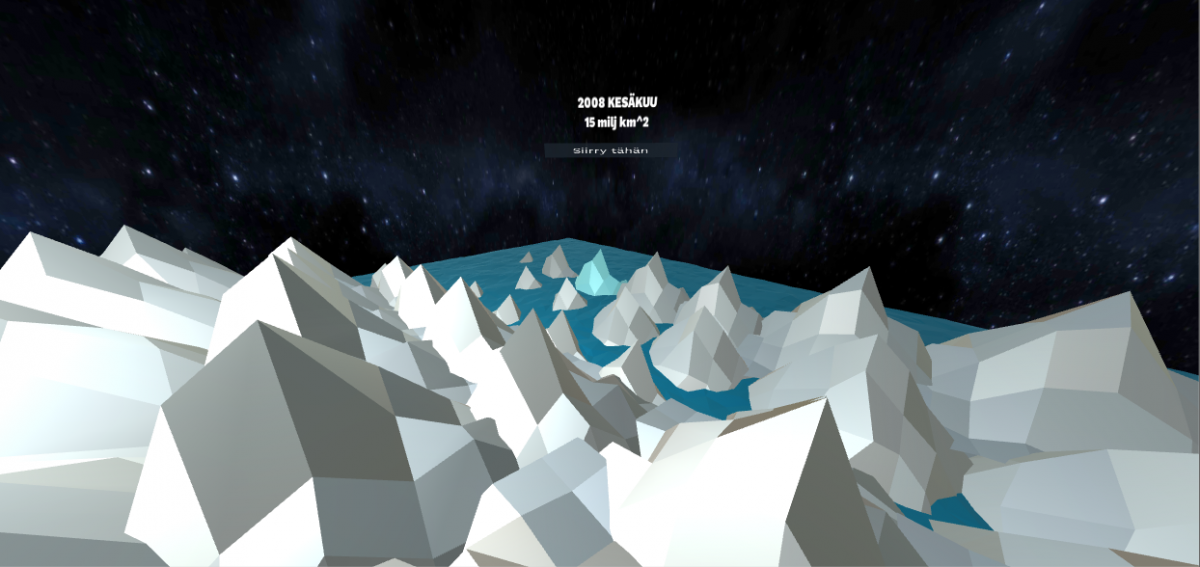 A screenshot from the final data visualization.
How to define this impact? It’s the memory of “being there”, the visceral feeling of having experienced something yourself. You remember turning your head and seeing something, walking past something, touching an object. It’s profoundly different from the impact of only reading, hearing or seeing something. This impact of VR is definitely one more reason to get excited about virtual reality.
